How Can We Help?
How to open and use the debug console in the GUAP Desktop Wallet
What is the debug console?
The debug console is a way to use advanced features of the wallet while in the guapcoin-qt GUI. It is similar to how a command-line user would issue RPC commands using guapcoin-cli.
How do I open the debug console?
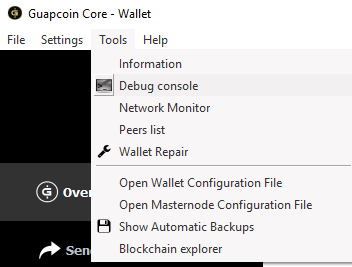
To open the debug console, you’ll use ‘Tools > Debug Console’ as shown below:
- In your wallet’s menu (usually in the top left of the window or screen depending on your OS), select Tools. It should be listed among File, Settings, Tools, and Help.
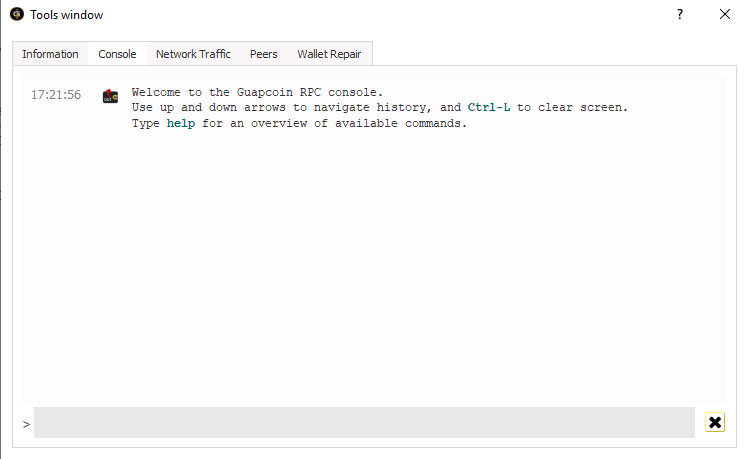
- Once you click tools, select Debug console and you should see a window appear similar to the one below:
- Once here, go ahead and enter commands at the bottom where noted in the image.
To use the debug menu, type a command and press Enter. Use the command “help” for a list of commands.


